Skip to content
Social Media App Use Among Affluent Households

This is the third article in our study & analysis of the media behavior of $100k+ income households. Part One and Part Two are available at nuvoodoo.com/articles.
In today’s crowded digital advertising universe, it’s not enough to know who is on which platform—you also need to understand how often they’re there. Drawing on our latest NuVoodoo Consumer Media Study (2,908 U.S. adults), nearly one in five respondents report household earnings above $100 K. Of those, around three-quarters fall in the $100 K–$199 K range, and nearly one-quarter exceed $200 K. This article drills into daily reach (or better) and compulsive frequency (≥4×/day) for social apps among higher-earning segments—so advertisers can target the platforms that deliver both scale and repeat exposures.
To set a usage benchmark, we include ubiquitous Google—even though it isn’t a social network. While Google’s ecosystem supports display ads, its core strength remains intent-driven search marketing. In contrast, social media platforms excel at precision targeting, using household demographics and expressed interests to deliver highly relevant reach.
Daily Reach: Who’s Checking In Every Day?
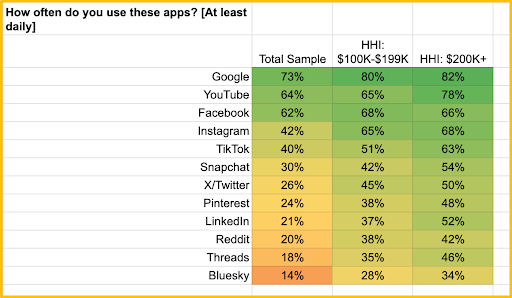
While top-rated YouTube and Facebook enjoy a marginal lift in usage among higher earning HH, Instagram & TikTok see a ~25-point jump in daily penetration among $200 K+ households versus the total sample.
LinkedIn doubles its daily reach—from 21% overall to 52% of top earners checking in daily.
Threads and Bluesky are quickly gaining footholds: nearly half of $200 K+ households open Threads every day, for example, compared to slightly less than one in five among our total sample.
Compulsive Frequency: Power Users by Income
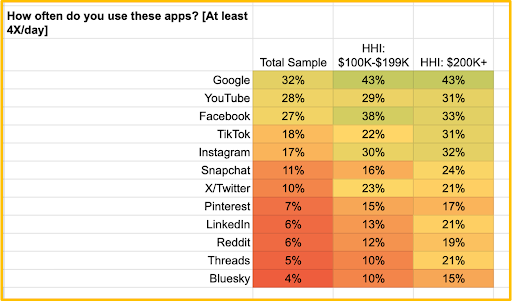
Roughly 30% of $200 K+ households open Instagram, TikTok, Facebook—and even YouTube—at least four times per day.
While lower ranking, Threads power-users among top earners surge to 21%, nearly quadrupling its overall sample.
LinkedIn isn’t just for occasional job-seekers: 21% of affluent users visit it four or more times daily.
What This Means for Advertisers Targeting Affluent HH
- Prioritize High Reach + High Frequency
- Instagram & TikTok lead the pack—>65% daily reach and ~30% compulsive use among top earners.
- YouTube and Facebook remain foundational platforms with both broad scale and solid repeat visits.
- Go Beyond the Obvious
- LinkedIn’s 52% daily reach and 21% high-frequency usage make it ideal for career- or status-oriented messaging.
- Threads and Bluesky deliver rapid adoption in affluent demos—test them now with organic efforts to build awareness and engagement.
- Creative & Budget Recommendations
- Rotate fresh creative frequently to match the high revisit rates.
- Allocate incremental spend to platforms where luxury audiences both are and return—maximize efficient impression delivery.
Looking Ahead
Next week, we’ll layer in direct-response performance—which apps drive the most sales among affluent shoppers and preferred payment methods within these segments. For now, these reach-and-frequency benchmarks equip you to sharpen your media plans and ensure your message lands where top-income consumers are—and when they’re most engaged.
NuVoodoo conducts research, makes marketing recommendations and implements digital campaigns for clients. Contact us at tellmemore@nuvoodoo.com for a no-obligation needs analysis consultation.