Skip to content
Put Your Station “Over the Top” (OTT)

NuVoodoo marketing guru Mike O’Connor has identified a new tactic that’s helping our clients play the Nielsen game successfully – despite the battlefield shifting dramatically since March. With so many working from home, we’ve put office telemarketing on the shelf and dedicated more of our clients’ budgets to reaching listeners AT HOME.
Since the lockdown in March, Mike and his team started seeing TV screens becoming a significant placement for YouTube ads. One particular YouTube metric really stood out: the conversion to video views lasting 30 seconds or longer. In the world of digital video, 30 seconds is just about forever. That was the first indication of a huge upshift in the time spent watching OTT content.
OTT stands for “over the top” and refers to streaming media offered directly to viewers via the internet. OTT bypasses cable, broadcast, and satellite television platforms and is accessed on personal computers, apps on mobile devices (such as smartphones and tablets), digital media players (including video game consoles), integrated Smart TV’s or TV’s connected to the internet through a device like Roku, Google Chromecast, etc.
While there are lots of options for advertisers in OTT, we wanted to know if the reach is big enough to justify expenditures. We also wanted to know if those likely to participate in PPM ratings are watching OTT TV at a more significant rate than the majority who would never carry a meter. So, weekend before last we fielded over 3,400 interviews across all PPM markets among adults 18-54. And there’s a tsunami of video viewing going on.
We split OTT viewing into two buckets: those watching OTT on Smart TV’s and connected devices like Roku, Google Chromecast, etc. (labeled OTT-CTV) AND those watching OTT on smartphones, tablets or computers (labeled OTT-Mobile/Comp). Groups of just under 1/3 apiece are spending 10+ hours per week with OTT in both modes.
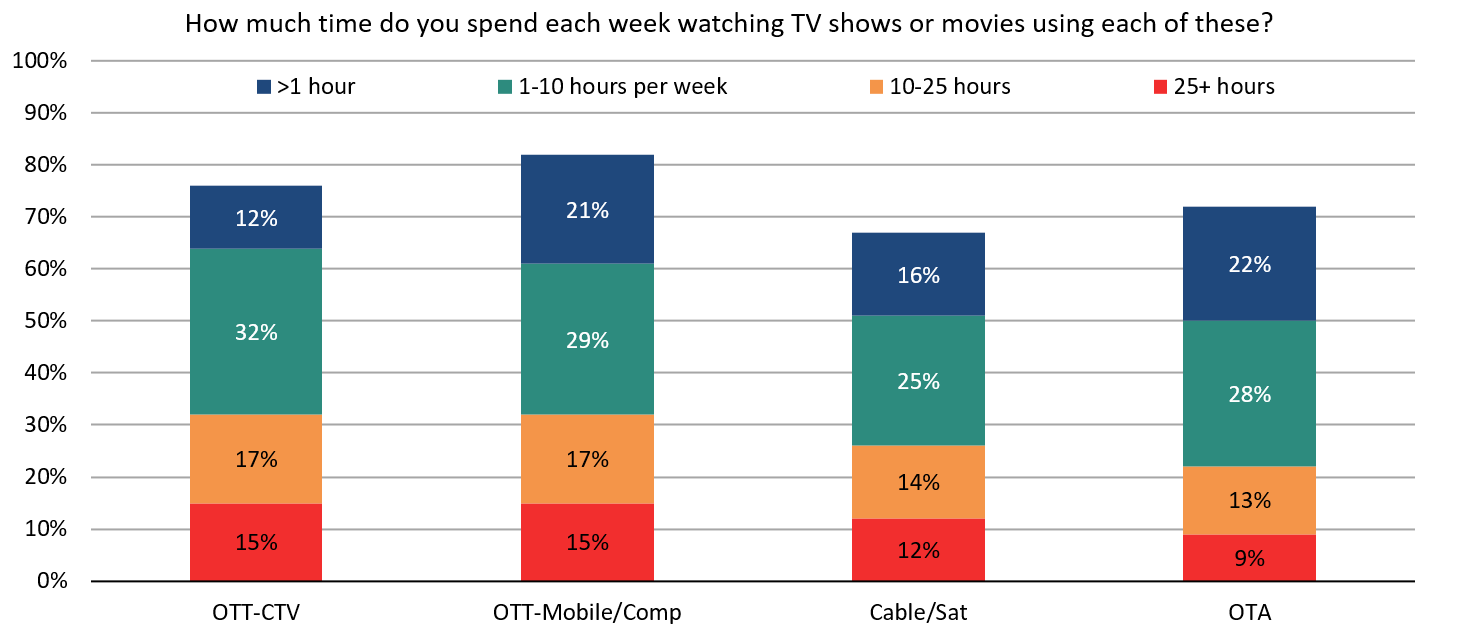
This is a BIG change. We watched years ago as Emmy nominations drifted from the broadcast networks to premium cable channels … and now we watch as they drift from premium cable channels to Netflix, Hulu, Disney+ and on and on. Even now, you can see that the groups spending 10+ hours a week with Cable or Satellite TV or Broadcast are smaller – about a quarter for Cable/Satellite and a fifth for OTA (over the air).
As we suspected, gender and demographics matter. Men are more likely than women to watch 10+ hours a week on Cable/Satellite and Over-the-air TV – primarily due to live sports. While digital-native 18-34’s are most likely to spend 10+ hours a week consuming OTT content on a computer, tablet or smartphone.

What about ratings likelies you ask? Among the PPM likelies we’ve identified using the proprietary questions we’ve developed to mimic the process of empaneling respondents (labeled “PPM Yes”), about 50% apiece are spending 10+ hours a week using either OTT/Connected TV or OTT content on a non-TV device. Those are BIG numbers compared to the overall sample (or the large subset of the sample who would reject the opportunity to carry a meter – the PPM No’s here). Also, notice the columns labeled PPM 60; that’s the subset of our PPM Yes group who say they listen to broadcast radio at least an hour – sixty minutes – per day. If you’re going to make a splash in the ratings, you need to connect with those heavy listeners from the ratings sample – and viewing of OTT/Connected TV is mammoth.

Mike and the NuVoodoo marketing team use third-party targeting from the Nielsen marketing cloud to reach the most likely ratings respondents and giving us the ability to deliver OTT video impressions based on heavy format and daypart listening. The result is a cost-efficient mix of OTT impressions across the spectrum of devices to keep budgets reasonable. More details of both the research and how we use OTT for marketing are available in a short video at nuvoodoo.com/webinars.
So, who’s down with OTT?